Home » simulation
Category Archives: simulation
3D Visualization of geological structures using Python: the case study of the Palomeque sheets
The goal of this paper is the construction of computerized 3D visualization of geological structures. Several Python applications have been used to adapt the paper map-based geological classical information to numerical geological maps represented in HTML files. The models include a map with the stratigraphic and structural contacts and symbols, five serial vertical sections, and a geological block diagram, all with real topography. This block diagram made with 2D figures allows a 3D visualization. Palomeque area (Murcia region, southeastern Spain) has been used as a key-case. This area consists of a deformed Upper Cretaceous to Oligocene succession belonging to the Internal Zone Malaguide Complex. The main structure consists of two thrust-fold sheets forming an imbricate system, also affected by a set of strike-slip faults with a sinistral regime. The constructed maps show a good agreement with the published classical geological maps and cross-sections demonstrating the benefits of using these Python applications.
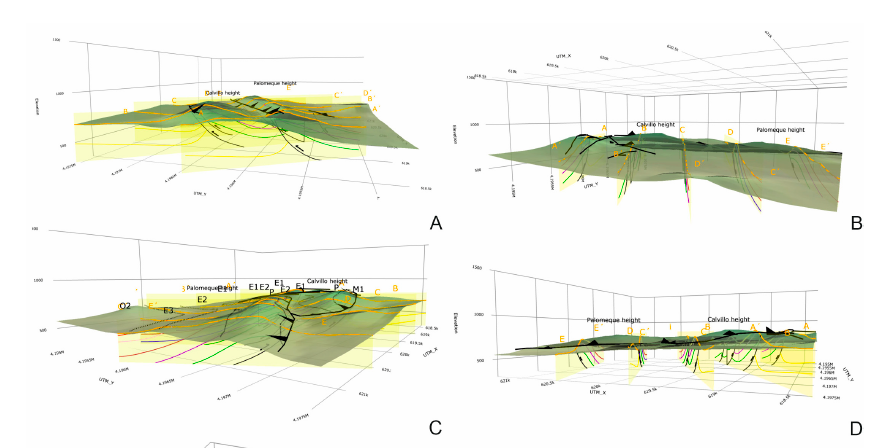
Cite as: Bullejos, M. and Martín-Martín, M. (2023): 3D Visualization of geological structures using Python: the case study of the Palomeque sheets (SE, Spain). Journal of Maps 19, NO. 1, 2282593 https://doi.org/10.1080/17445647.2023.2282593
Python libraries and k-Nearest neighbors algorithms to delineate syn-sedimentary faults
This paper introduces a methodology based on Python libraries and machine learning k-Nearest Neighbors (KNN) algorithms to create an interactive 3D HTML model (3D_Vertical_Sections_Faults_LRD.html) that combines 2D grain-size KNN-prediction vertical maps (vertical sections) from which syn-sedimentary faults and other features in sedimentary porous media can be delineated. The model can be visualized and handled with conventional web browsers. The grain-size physical parameter is measurable, constant over instrumental time, handleable mathematically, and its range can be associated to lithological classes. Grain-size input data comes from a public database of 433 boreholes in the Llobregat River Delta (LRD) in NE Spain. Four lithological classes were defined: Pre-Quaternary basement, and Quaternary gravel, sand, and clay–silt. Using a new KNN-prediction algorithm, seven NW–SE (transversal) and three SW–NE (longitudinal) vertical sections were created following the orientation of faults identified in surface and detected in reflection seismic geophysical surveys. For exploratory K values in the 1–75 range were used. K around 25 provides the general and smoothy shape of the basement top surface, whereas K = 1 is a optimal value to represent the heterogeneity of the LRD at short distance. Using a new KNN-prediction confidence algorithm inspired in the Similarity Ratio algorithm for machine-learning KNN, the vertical sections overall confidence was evaluated as satisfactory. A general decreasing confidence trend according to the decreasing data density with depth and from inland to seaward was found. The vertical sections created with K = 1 show horizontal interruptions (displacements or vertical steps) in the basement continuity and in the Quaternary coarse bodies (gravel and sand) attributable to the action of Quaternary active faults. These faults have been linked or correlated with well-known active faults in the area related in much cases with the Valencia Trough opening. Moreover, several faults detected in surface and other identified in this paper by the first time have been revealed as fault zones made of fault branches with different steps in an echelon-like arrangement.
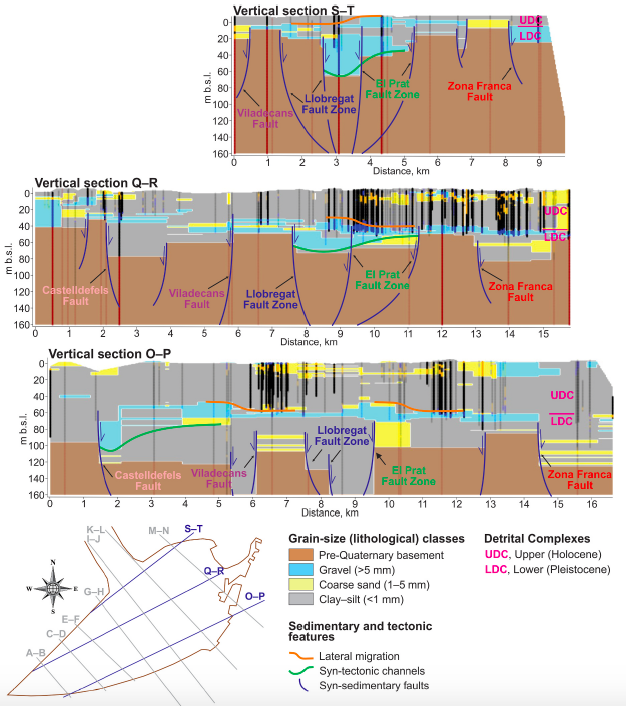
Faulting seems to be more evident in the Pleistocene Lower Detrital Complex and much less active or inactive in the Holocene Upper Detrital Complex. Syn-tectonic gravel channels faulty controlled, progradation of gravel lobes, and lateral migration of channel bars were also observed. At its current development stage, this methodology could also be applied to other geological environments, making the due minor modifications of the code, and is especially suitable to reduce the high (usually unmeasurable) uncertainty associated to the qualitative geological data used in more complex numerical tools aimed at modelling a lot of geological resources (groundwater, minerals, geothermal, petroleum) or different Earth phenomena.
Cite as: Martín-Martín, M., Bullejos, M., Cabezas, D., Alcalá, F. J., (2023). Using python libraries and k-Nearest neighbors algorithms to delineate syn-sedimentary faults in sedimentary porous media. Marine and Petroleum Geology, 153. 106283. doi: 10.1016/j.marpetgeo.2023.106283
K-nearest neighbors algorithm used for classifying geological variables.
The k-nearest neighbors (KNN) algorithm is a non-parametric supervised machine learning classifier; which uses proximity and similarity to make classifications or predictions about the grouping of an individual data point. This ability makes the KNN algorithm ideal for classifying datasets of geological variables and parameters prior to 3D visualization. This paper introduces a machine learning KNN algorithm and Python libraries for visualizing the 3D stratigraphic architecture of sedimentary porous media in the Quaternary onshore Llobregat River Delta (LRD) in northeastern Spain. A first HTML model showed a consecutive 5 m-equispaced set of horizontal sections of the granulometry classes created with the KNN algorithm from 0 to 120 m below sea level in the onshore LRD. A second HTML model showed the 3D mapping of the main Quaternary gravel and coarse sand sedimentary bodies (lithosomes) and the basement (Pliocene and older rocks) top surface created with Python libraries. These results reproduce well the complex sedimentary structure of the LRD reported in recent scientific publications and proves the suitability of the KNN algorithm and Python libraries for visualizing the 3D stratigraphic structure of sedimentary porous media, which is a crucial stage in making decisions in different environmental and economic geology disciplines.
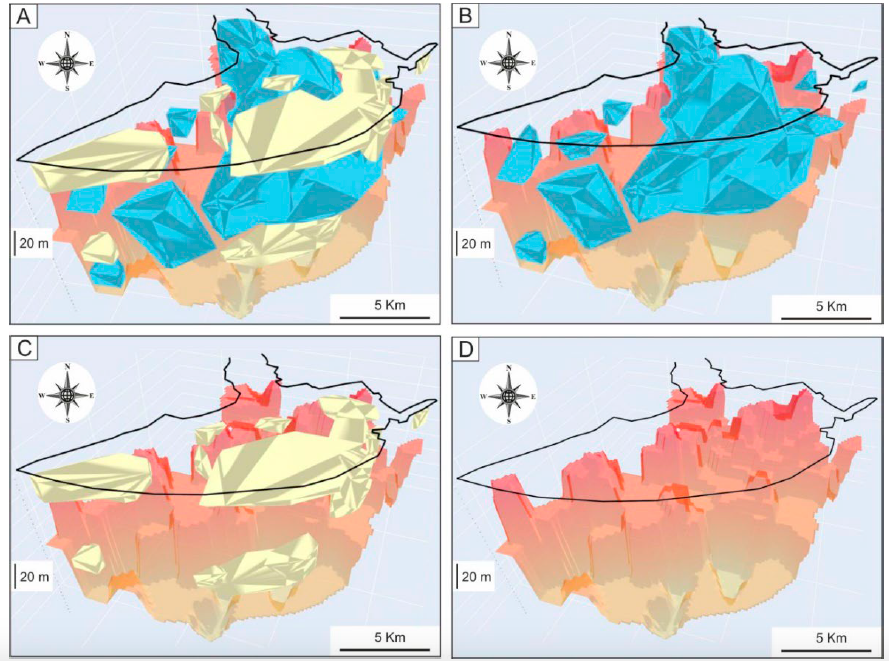
Interactive figures here
A Python Application for Visualizing the 3D Stratigraphic Architecture
A Python application for visualizing the 3D stratigraphic architecture of porous sedimentary media has been developed. The application uses the parameter granulometry deduced from borehole lithological records to create interactive 3D HTML models of essential stratigraphic elements.
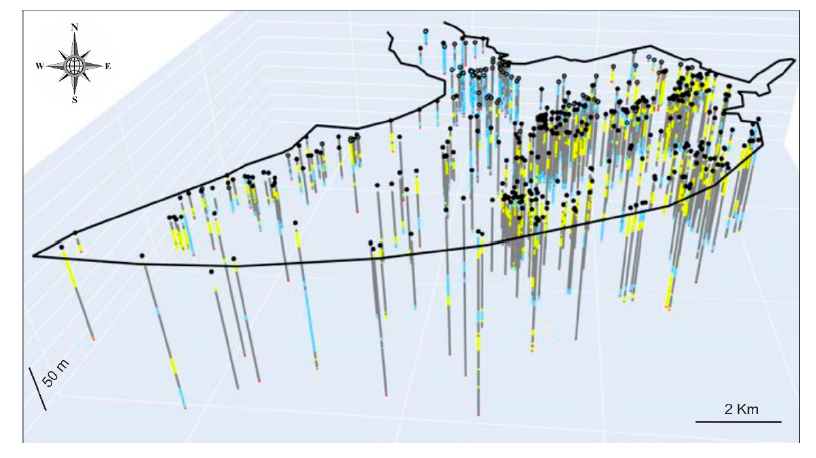
On the basis of the high density of boreholes and the subsequent geological knowledge gained during the last six decades, the Quaternary onshore Llobregat River Delta in northeastern Spain was selected to show the application. The public granulometry dataset produced by the Water Authority of Catalonia from 433 boreholes in this strategic coastal groundwater body was clustered into the clay–silt, coarse sand, and gravel classes. Three interactive 3D HTML models were created. The first shows the location of the boreholes granulometry. The second includes the main gravel and coarse sand sedimentary bodies (lithosomes) associated with the identified three stratigraphic intervals, called lower (>50 m b.s.l.) in the distal Llobregat Delta sector, middle (20–50 m b.s.l.) in the central Llobregat, and upper (<20mb.s.l.) spread over the entire Llobregat. The third deals with the basement (Pliocene and older rocks) top surface, which shows an overall steeped shape deepening toward the marine platform and local horsts, probably due to faulting. The modeled stratigraphic elements match well with the sedimentary structures reported in recent scientific publications.
This proves the good performance of this incipient Python application for visualizing the 3D stratigraphic architecture, which is a crucial stage for groundwater management and governance.
Compactation in sedimentary basins
Subsidence analysis is an important technique in the study of sedimentary basins but the effects of compaction must be “backstripped”. The compaction of sediments is also of importance for petroleum and water reservoir research with very important economic derivations. Most methods for calculating compaction are based on empirically derived porosity-depth relationships from a variety of known sediment types. The challenge of this paper is to apply alternative methods for calculating compaction in sedimentary basins based on: physical calculation with elastic by Steinbrenner, oedometric and change of the specific weight of the sediment methods; and use of Loadcap software.
The Triassic to Lower Miocene 3025m thick succession of Sierra Espuña (SE Spain) is used as case study for the calculations. In this succession former mineralogical studies and apatite fission-track suggested an original thickness between 4 and 6km. The validity of each one of the proposed methods is discussed, as well as, compared for the whole succession compaction but also separately for hard vs soft sediments and for thick vs thin beds.
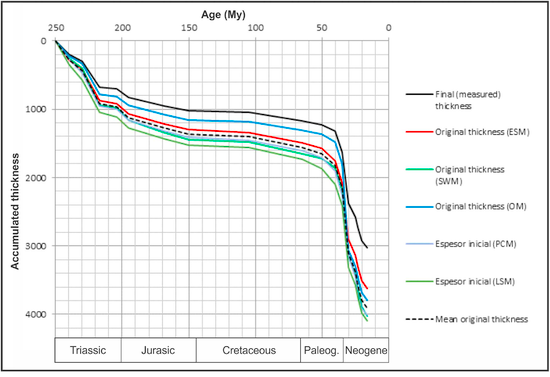
The compaction values obtained with the alternative methods are similar to those resulting with the lower-limit curves of the porosity-depth change method. The new methods have provided values slightly higher than 4km for the whole original thickness using the geotechnical software and the change of the sediments specific weigh methods; meanwhile values below 4km for other methods. So, in our opinion, the geotechnical software and the change of the specific weight of the sediment methods are compatible with mineralogical constraints and also, the input data are usually better known and easier to determinate. Otherwise, the elastic method seems only accurate for soft sediments; meanwhile the oedometric method is highly influenced by the thickness of the considered beds.
shallow water stratified simulation
The computational simulation of shallow stratified fluids is a very active research topic because these types of systems are very common in a variety of natural environments. The simulation of such systems can be modeled using multilayer shallow-water equations but do impose important computational requirements, especially when applied to large domains.
General Purpose Computing on Graphics Processing Units (GPGPU) has become a vivid research field due to the arrival of massively parallel hardware platforms (based on graphics cards) and adequate programming frameworks which have allowed important speed-up factors with respect to not only sequential but also parallel CPU based simulation systems.
In this work we present simulation of shallow stratified fluids with an arbitrary number of layers using GPUs. The designed system does fully adapt to the many-core architecture of modern GPUs and several experiments have been carried out to illustrate its scalability and behavior on different GPU models. We propose a new multilayer computational scheme for an underlying 2D mathematical model. This scheme is capable of handling an arbitrary number of layers. The system adds no overhead when used for two-layer scenarios, compared to an existing 2D system specifically designed for just two layers.

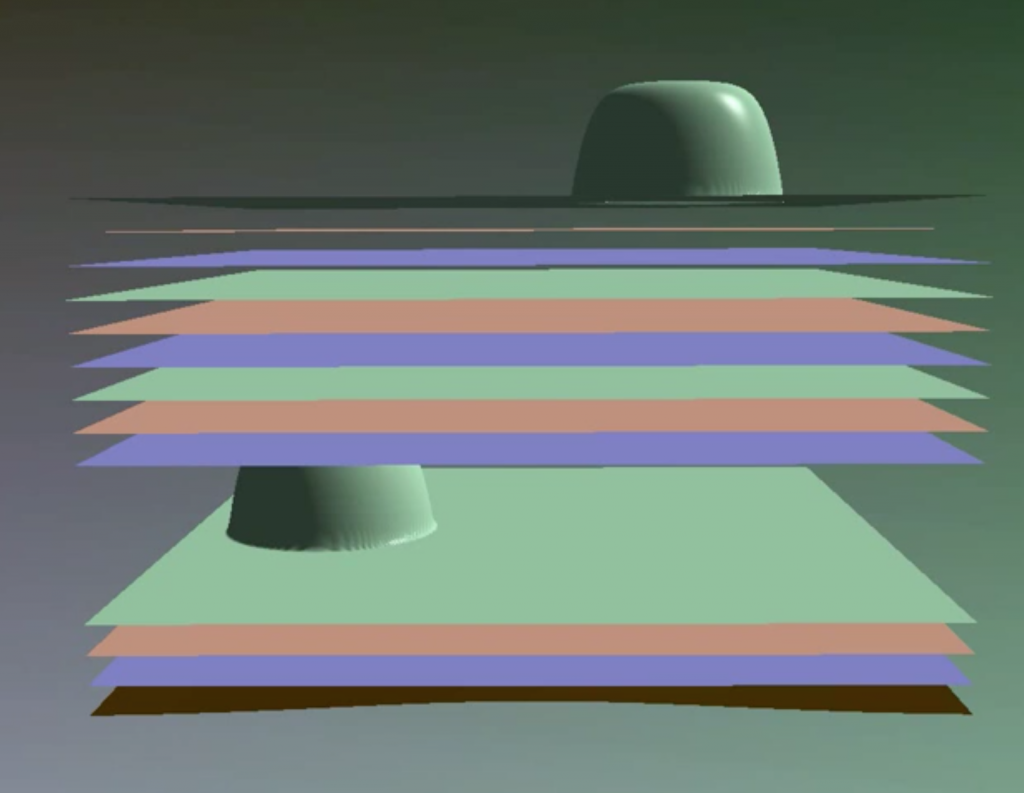
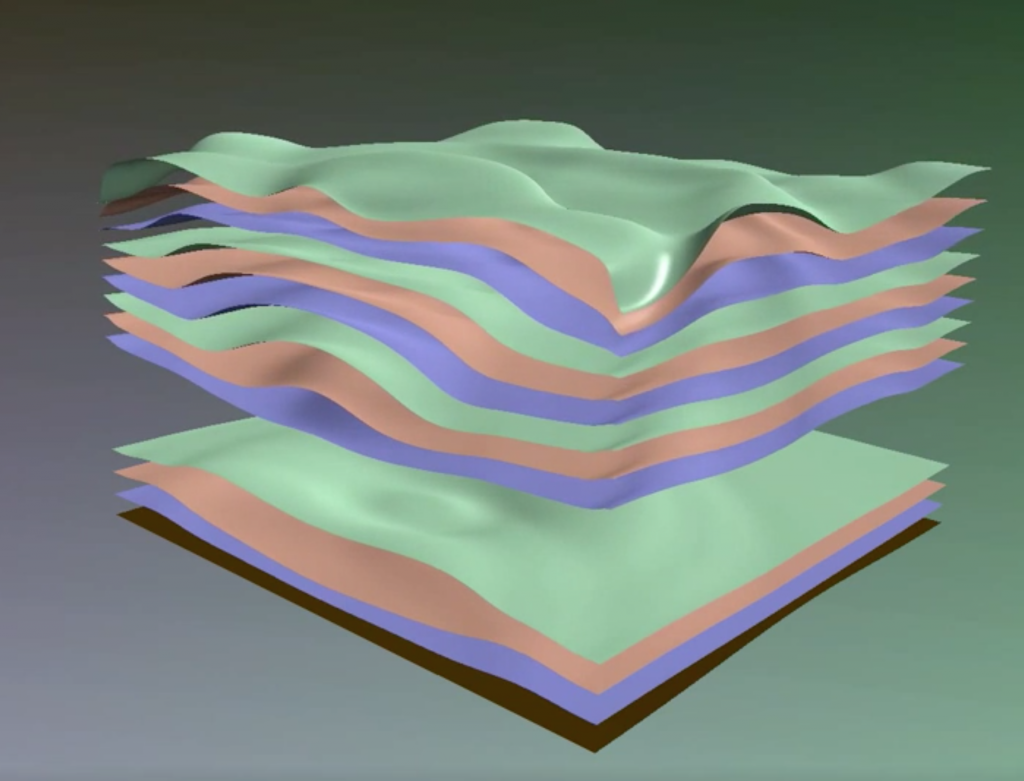
The GPU computes the evolution in time of the interfaces between several layered fluid types (for a given initial configuration) and displays those interfaces as solid surfaces, as soon as the output from each computing step is available. The user can rotate the view interactively, so he can better observe the layers’ evolution.
Here you can view two screen-shots taken from the simulation program while running. First one the initial layers configuration is shown.
Then It is shown the resulting layers configuration after the simulation has been running for some time.
These screen captured videos (see links below) show the simulation program running in real-time, for various scenerarios. You can observe how the user is able to manipulate the view:
https://youtu.be/U3DzJ1yPIZ8
https://youtu.be/1Y01dHevmWg
https://youtu.be/AQmNz53yL8U
https://youtu.be/Q61epORRHVw
https://youtu.be/x58c-VTGj_0
https://youtu.be/b5tM6TnZRXA
Recent Comments