Home » PID2020-114381GB-I00 (Page 3)
Category Archives: PID2020-114381GB-I00
The Numidian formation in the Central-Western Mediterranean
The widely debated late Oligocene-middle Miocene Numidian Fm (NF) consists of supermature quartzose sediments deposited in the Maghrebian Flysch Basin (MFB) outcropping from the Betic Cordillera to the Southern Apennine passing by the Maghrebian Chain. The NF is commonly composed of three lithostratigraphic members and is characterized by two vertical successions (Type A and Type B) corresponding to different sedimentation areas in the MFB. It is noteworthy the occurrence of widespread lateral successions of the NF (Types C, D and E) indicating in some cases an interference of the Numidian sedimentation with other different depositional systems and supplies. The Type C ‘Mixed Successions’, deposited in depocentre areas, are composed of supermature Numidian supply interfingering with immature siliciclastic materials, coming from the internal portion of the MFB. The Type D consists of supermature Numidian materials supplied from the Africa Margin (external sub-domains) deposited in sub-basins on the Africa-Adria margins, outside the typical Numidian depositional area. The Type E, which stratigraphically overlies both the South Iberian Margin (SIM) and the Mesomediterranean Microplate (MM), represents the migration of the Numidian depositional system to reach the opposite margins of the MFB. The occurrence at a regional scale of all the above-mentioned lateral successions reveals a great evolutionary complexity resulting also from further constraints, which must be considered for palaeogeographic and palaeotectonic reconstructions. Another important point deals with the diachronism of the top of the NF, observed eastward from the Betic-Rifian Arc and the Algerian-Tunisian Tell (Burdigalian p.p.) to Sicily (Langhian p.p.) and up to the Southern Apennine (at least Langhian/Serravallian boundary) which can be related with eastwards delay in the MFB closure.
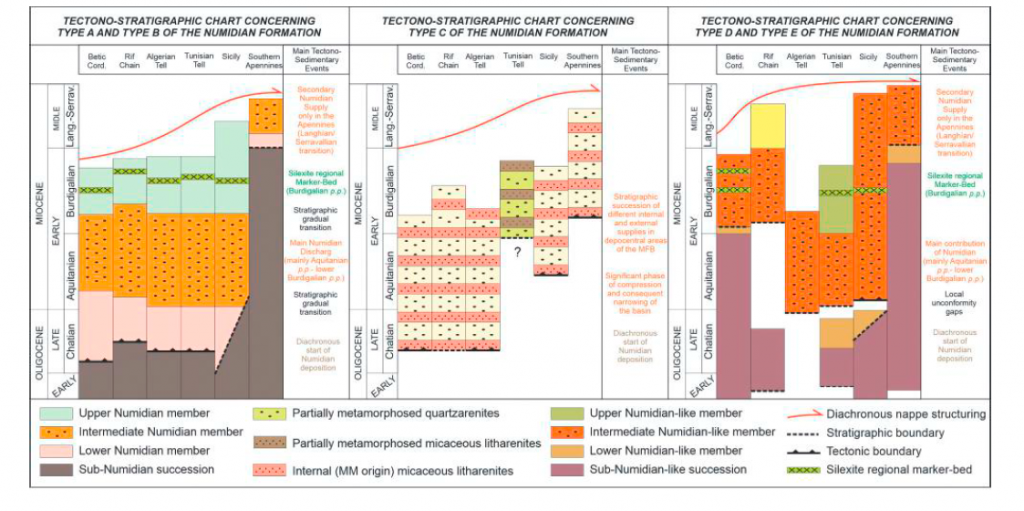
The palaeogeographic reconstruction of the Numidian depositional area presented in this paper,which is also included into a global kinematic model, represents a first attempt to use the software GPlates for this subject.
Cite as: Belayouni, H., Guerrera, F., Martin-Martin, M., Le Breton, E., and Tramontana, M. (2023). The Numidian formation and its Lateral Successions (Central-Western Mediterranean): a review. International Geology Review, DOI: 10.1080/00206814.2023.2199429
Eocene carbonate platform of the Malaguides of the westermost Tethys
The Eocene Peñicas (Almería) and Harania (Málaga) stratigraphic sections from the Malaguide Complex (Betic Cordillera, South Spain) belonging to the Mesomediterranean Microplate from the westernmost Tethys (about 35◦N) have been studied. The Eocene sections cover the Cuisian to middle Lutetian deposits, which show several lithofacies representing shallow marine platform realms. Based on the fossiliferous assemblage, texture and fabrics, eight microfacies related to inner to outer ramp settings were defined. In the inner ramp of the Harania section abundant colonial corals have been recognized. The Eocene deposits are arranged into a transgressive succession composed by three minor transgressive-regressive sedimentary cycles. The Eocene fossiliferous assemblage shows a mixture of photozoan (Larger Bentic Foraminifera, green and red calcareous algae and corals) and heterotrophic (mollusks, echinoids, bryozoans, small benthic and planktic foraminifers) elements, suggesting euphotic to mesophotic conditions in oligo-mesotrophic marine warm-waters at low-middle latitudes. This assemblage indicates a transition from photozoan to heterozoan carbonates and in particular a shift towards outer marine ramp settings.
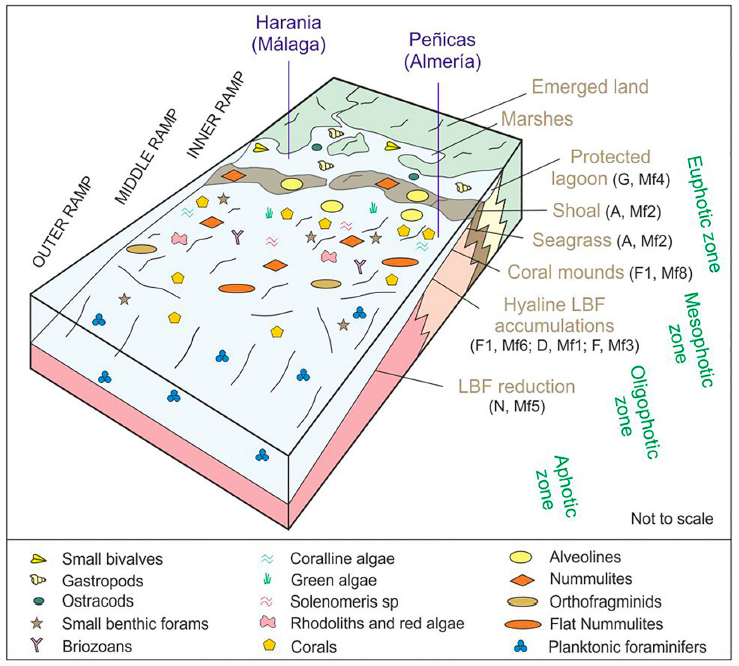
During the Early Eocene, the widespread distribution of Larger Benthic Foraminifera leads in the Tethyan domains to disappearance or extreme reduction of coral constructions. Nevertheless, abundant corals associated to inner ramp realms have been observed in the Harania stratigraphic section indicating that corals could continue to develop in the westernmost Tethys at the transition to the Atlantic Ocean, in contrast with respect to other Tethyan sectors. Therefore, the Ypresian-Lutetian time-span is a transitional period for the global temperature during which corals locally survived only where optimal ecologic conditions occurred, preferably in marginal contexts, as it seems to have happened in the studied area.
Oligocene-Lower Miocene sandstones of Western Tethys
The changing nature of detrital signatures in clastic wedges of the Circum-Mediterranean orogenic systems reflect the provenance relations from different source rocks of evolving geo-puzzle terranes, including ophiolite bearing, uplifted continental crust (both shallow to deep crust terranes), volcanic and sedimentary source rocks. We selected here sandstone suites directly occurring over the Mesomediterranean Micropaleoplate during the final stages of closure of the western-southern Tethyan realm. They are unconformably over the internal domains of the Circum-Mediterranean thrust belts, and include Oligocene-to-lower Miocene siliciclastic formations of the Betic Cordillera (As, Bosque, Río Pliego, El Niño, Ciudad Granada, Fuente-Espejos, Alozaina and Viñuela fms), Rif Chain (Fnideq and Sidi Abdeslam fms), and Calabrian terranes (Paludi, Pignolo and Stilo Capo d’Orlando fms). All these sandstone suites range from quartzolitic to quartzofeldspathic detrital modes reflecting close relations with their Paleozoic metasedimentary and plutonic source rocks and their related Mesozoic sedimentary covers.
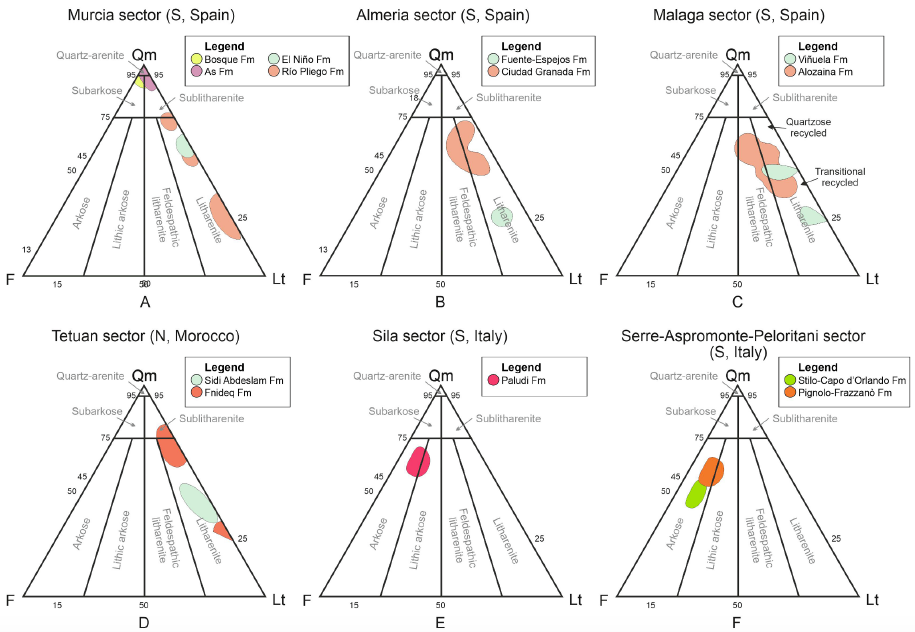
Marked differences have been recognized from western (Betic-Rif) to eastern (Calabria) portions in terms of detritic suites. Detrital suites of the Betic-Rif portions reflect a transition between a craton, transitional and recycled orogenic provenance type. Contrarily, detrital suites of the Calabria portions reflect their transition from transitional continental to basement uplift orogenic provenance reflecting deposition in wedge-top basins during final subduction of the Magrebian-Lucanian-Ionian Basin below the Mesomediterranean and the opening of the Mediterranean basin as a backarc.
Provenance and paleogeographic implications for the Cenozoic sedimentary cover of the Ghomaride Complex (Internal Rif Belt), Morocco
The Cenozoic sedimentary cover from the Ghomaride Complex (Internal Rif Belt) has been studied in the Tetuan area (N Morocco) where a suite of sedimentary successions from shallow-marine to deep-marine environments crops out. For that purpose stratigraphic relations and petrological and geochemical signatures have been analyzed. Sandstone suites of the overall succession are heterogeneous and testify a multi-source area, in response of accretionary processes of the Ghomaride-Malaguide units and the exhumation of the lower units of the Internal Rif Zone (e.g. Sebtide-Alpujarride Complex). Pre-orogenic and Syn-orogenic (according to the eoalpine phase) deposits have been identified consisting in two depositional sequences: lower Paleocene and Cuisian-Bartonian, and upper Oligocene-upper Aquitanian and lower Burdigalian, respectively. Pre-orogenic deposits are mainly intra-arenite and hybrid arenites made of a minor amount of siliciclastic detritus but with abundance of intrabasinal carbonate grains. The syn-orogenic sandstone suites are quartzolithic, having abundance of low-grade metamorphic and sedimentary lithic fragments. Sedimentary lithic fragments are derived from the Mesozoic successions of the Ghomaride-Malaguide Complex while metamorphic detritus is related to an unknow Internal Rif Zone basement that was exhumed starting from the late Oligocene and mainly early Miocene. Modal analyses of sandstone suites for the extrabasinal grains mainly indicate lower rank metamorphic and sedimentary source terranes of a recycled orogen. Major and trace elements coupled to the mineralogical composition of the mudrock samples indicate a provenance from felsic source area(s) with a minor but not negligible contribution from mafic rocks mainly in the syn-orogenic suites.
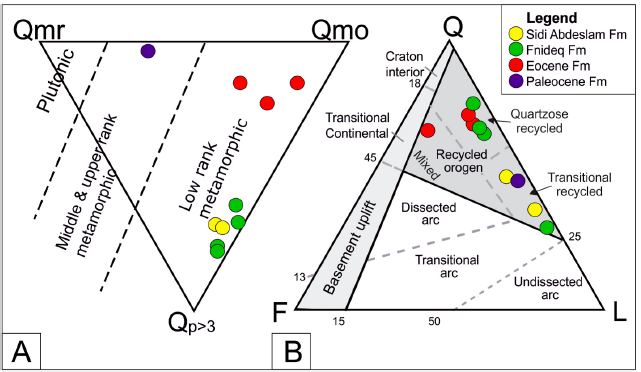
Geochemical analyses (Al–Ti–Zr ternary plot) indicate minor reworking and recycling processes before the final deposition through prolonged processes of sedimentary transportation. The trends evident in both CIA and CIA’ diagrams indicate source areas characterized by moderate weathering in non-steady-state conditions with a weak change of weathering condition from the pre-orogenic to the syn-orogenic cycle. Deposition during the Paleocene and Eocene, took place in the southern continental margin of the Ghomaride-Malaguide domain as a carbonate ramp. Contrarily, sedimentation in the late Oligocene-late Aquitanian took place in wedge-top basins within the Ghomaride- Malaguide domain. These changes occurred during the Burdigalian, when back arc basins were developed in the Internal Betic-Rif Zone. The Cenozoic reconstructed record was contemporaneous of the structuring of the Circum-Mediterranean chains and the Ghomaride-Malaguide Complex played a key role in the geodynamic evolution of the Rif Cordillera, representing a key tectonic element of the western Mesomediterranean domains.
The Cenozoic evolution of the Intrarif (Rif, Morocco)
The sedimentary-tectonic evolution of the Cenozoic strata of the El Habt and Ouezzane Tectonic Units (Intrarif, External Rif) in Morocco is presented by a new work by Martín-Martin et al., (2022) in Geosphere.
New data provide information about the depositional architecture and enable a correlation of the evolution of the External Rif in Morocco with that of the Betic Cordillera in Spain and the Tunisian Tell, which provides new insights for hydrocarbon exploration in the region regarding possible source, reservoir, and seal rocks. The reconstructed Cenozoic succession was bio-chronologically defined, and the major unconformities and stratigraphic gaps were identified. The presence of these unconformities allowed three main stratigraphic sequences to be defined by age: Danian p.p., early Ypresian–early Bartonian p.p., and the early Rupelian–early Serravallian p.p. Three secondary stratigraphic sequences in the former upper main sequence were also defined by age: early Rupelian–late Chattian p.p., Burdigalian p.p., and the Langhian–Serravallian p.p. The depositional setting evolved from deep basin during the Late Cretaceous–Paleocene to external platform-slope during the Eocene–Miocene.
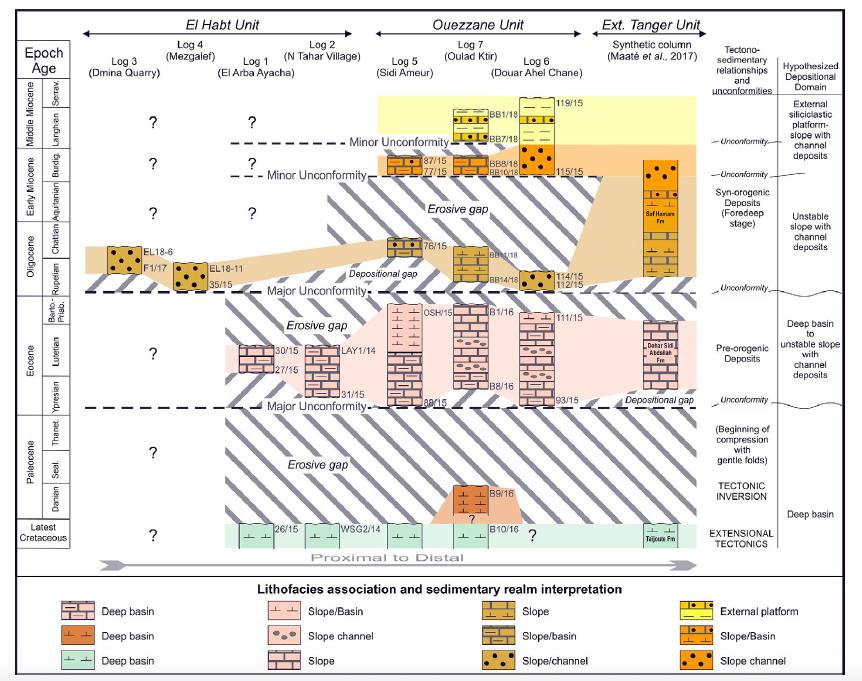
The Cenozoic sandstones contain metamorphic and sedimentary rock fragments derived from a recycled orogen source area. The clay mineralogy in the Cenozoic strata consists of associations of Ill+(I–S) ± Sme, Ill+(I–S) ± Sme+Kln and Ill+(I–S) ± Sme+Kln+ Chl. These associations indicate an initial unroofing in the Paleogene period, then in the Cretaceous period, and finally in the Late Jurassic period during the Eocene–Oligocene. This detritus was followed by variable amounts of a sedimentary mix of Paleogene to Late Jurassic terrains due to several phases of erosion and deposition partly related to syn-sedimentary tectonics during the Miocene. Equivalent features (similar types of sediments, tectofacies, gaps, and unroofing) were also recognized along the Betic Cordillera in Spain and Maghrebian Chain (Morocco and Tunisia) and interpreted as related to a pre-nappe tectonic activity of soft basement folding, which occurred during the Paleogene after the generalized tectonic inversion (from extension to compression) occurred in the Late Cretaceous. The Upper Cretaceous is considered to be the hydrocarbon source rock, while the fractured Eocene and the porous Oligo-Miocene suites are proposed as possible hydrocarbon reservoirs. The Cenozoic stratigraphic architecture and the nappe structure of the region could provide the necessary trap structures.
Historical Earthquakes in Valencia
The “1396 Tabernes” earthquake occurred in the Valldigna valley and it has been considered one of the largest Iberian Peninsula recorded earthquakes. The information used for such claims has always been from secondary sources in the area because the originals were believed to be lost. In this work, the recently edited copy of the book about the Royal Monastery Nuestra Señora de la Valldigna history, the “Chronological history” of Father Estevan Gil, has permitted to correct the date of December 16th instead of December 18thfor the main earthquake. The earthquake damage is reinterpreted from the original source. In addition, the importance of the November 7th 1330 earthquake which represents the first destruction of the monastery, is pointed out. The original book provides information on the last destruction of the church in the 1644 earthquake, its damage and reconstruction. Together with another book, also recently published by Tomás Gómez, on the castilian visit of 1666, it allows us to discover what the monastery was like and understand the damage and reconstruction. Finally, two other earthquakes are mentioned in the years 1724 and 1748 that are also reflected in Father Gil’s book.
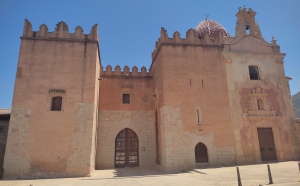
Cite as: Tent-Manclús, J. E. (2022): Los terremotos del sur de la provincia de Valencia según las fuentes del Real Monasterio de Nuestra Señora de la Valldigna (E de España, Provincia de Valencia). Cuaternario y Geomorfología, 36 (1-2): 77-103. https://doi.org/10.17735/cyg.v36i1-2.91108
K-nearest neighbors algorithm used for classifying geological variables.
The k-nearest neighbors (KNN) algorithm is a non-parametric supervised machine learning classifier; which uses proximity and similarity to make classifications or predictions about the grouping of an individual data point. This ability makes the KNN algorithm ideal for classifying datasets of geological variables and parameters prior to 3D visualization. This paper introduces a machine learning KNN algorithm and Python libraries for visualizing the 3D stratigraphic architecture of sedimentary porous media in the Quaternary onshore Llobregat River Delta (LRD) in northeastern Spain. A first HTML model showed a consecutive 5 m-equispaced set of horizontal sections of the granulometry classes created with the KNN algorithm from 0 to 120 m below sea level in the onshore LRD. A second HTML model showed the 3D mapping of the main Quaternary gravel and coarse sand sedimentary bodies (lithosomes) and the basement (Pliocene and older rocks) top surface created with Python libraries. These results reproduce well the complex sedimentary structure of the LRD reported in recent scientific publications and proves the suitability of the KNN algorithm and Python libraries for visualizing the 3D stratigraphic structure of sedimentary porous media, which is a crucial stage in making decisions in different environmental and economic geology disciplines.
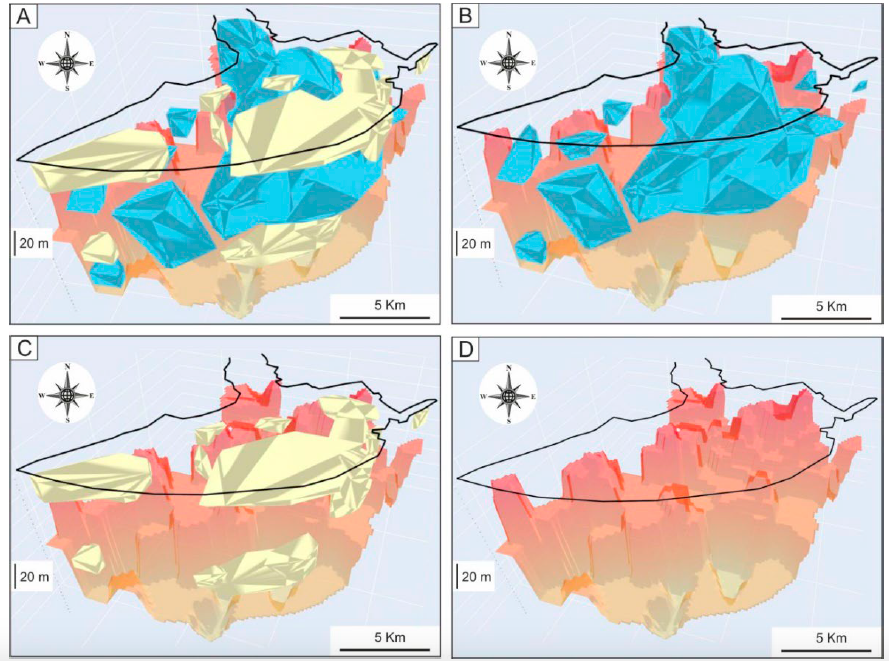
Interactive figures here
A Python Application for Visualizing the 3D Stratigraphic Architecture
A Python application for visualizing the 3D stratigraphic architecture of porous sedimentary media has been developed. The application uses the parameter granulometry deduced from borehole lithological records to create interactive 3D HTML models of essential stratigraphic elements.
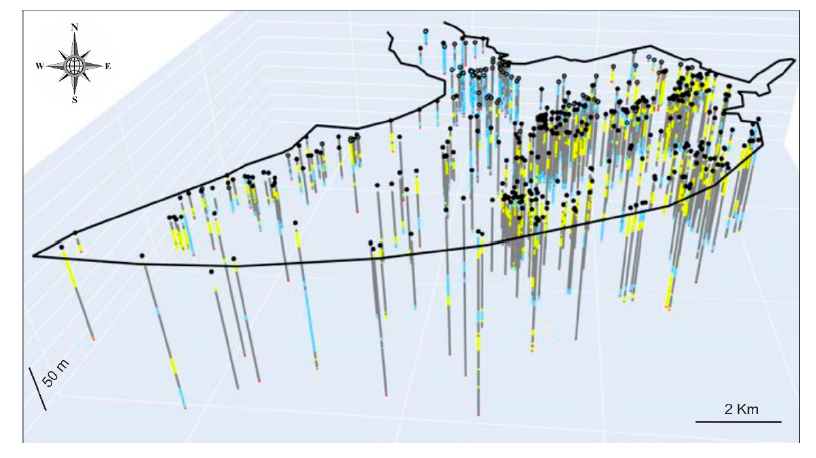
On the basis of the high density of boreholes and the subsequent geological knowledge gained during the last six decades, the Quaternary onshore Llobregat River Delta in northeastern Spain was selected to show the application. The public granulometry dataset produced by the Water Authority of Catalonia from 433 boreholes in this strategic coastal groundwater body was clustered into the clay–silt, coarse sand, and gravel classes. Three interactive 3D HTML models were created. The first shows the location of the boreholes granulometry. The second includes the main gravel and coarse sand sedimentary bodies (lithosomes) associated with the identified three stratigraphic intervals, called lower (>50 m b.s.l.) in the distal Llobregat Delta sector, middle (20–50 m b.s.l.) in the central Llobregat, and upper (<20mb.s.l.) spread over the entire Llobregat. The third deals with the basement (Pliocene and older rocks) top surface, which shows an overall steeped shape deepening toward the marine platform and local horsts, probably due to faulting. The modeled stratigraphic elements match well with the sedimentary structures reported in recent scientific publications.
This proves the good performance of this incipient Python application for visualizing the 3D stratigraphic architecture, which is a crucial stage for groundwater management and governance.
Field work in the Eocene Prebetic II
The rain in Spain…
Well the second field work campaign in the Eocene Prebetic was conditional by the bad weather, rain, wind, snow and cold.
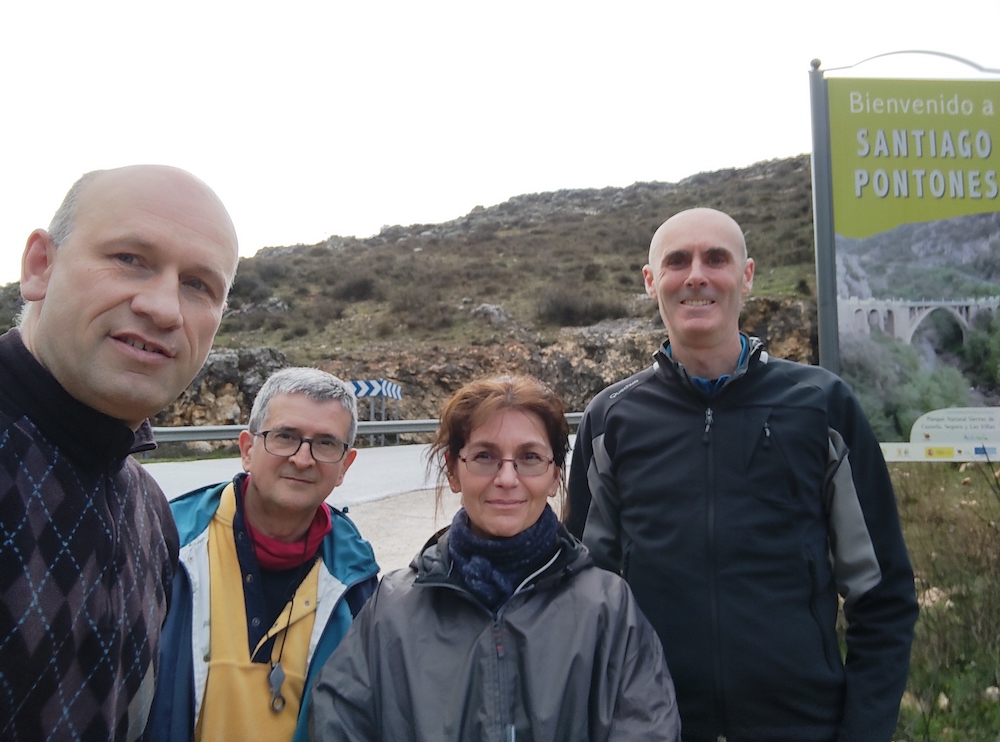
The picture shows the members of the team imply in this field try to the Eocene rocks within the provinces of Alicante and Murcia.
This is the second field season of the project of the Spanish research agency (Agencia Estatal de Investigación) of the Spanish Science and innovation minister (Ministerio de Ciencia e Innovación) entitle as “EVOLUCION TECTONO-DEPOSICIONAL DE CUENCAS SEDIMENTARIAS CENOZOICAS: CARACTERIZACION 2D-3D Y MEJORA DE PATRONES ESTANDAR” (PID2020-114381GB-I00). See previous post.
Field work in the Eocene Prebetic
The good weather in Alicante during the winter season has permitted to do the first field season of our project of the Spanish research agency (Agencia Estatal de Investigación) of the Spanish Science and innovation minister (Ministerio de Ciencia e Innovación) entitle as “EVOLUCION TECTONO-DEPOSICIONAL DE CUENCAS SEDIMENTARIAS CENOZOICAS: CARACTERIZACION 2D-3D Y MEJORA DE PATRONES ESTANDAR” (PID2020-114381GB-I00). See previous post.
The picture shows the members of the team imply in this field try to the Eocene rocks within the provinces of Alicante and Murcia.
Crina Miclaus (Alexandru Ioan Cuza University)
Josep Tosquella (Huelva University)
Manuel Martin-Martin (Alicante University)
Jose Enrique Tent-Manclus (Alicante University)

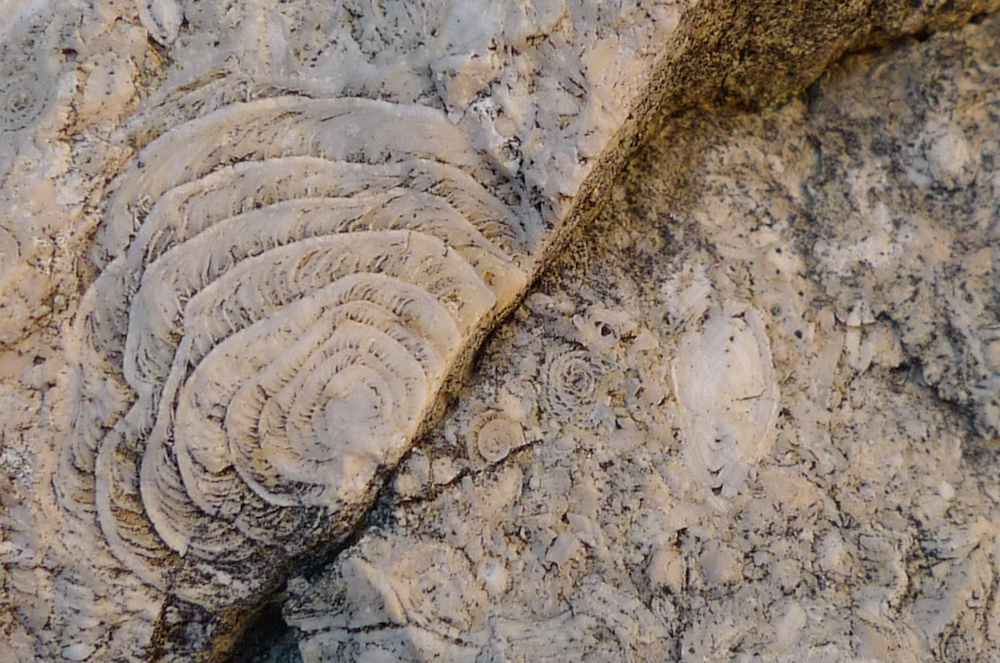
Next picture shows a nummulite-rich limestone in a quarry near Onil, one of the visited sections in our field work.
Recent Comments